Bryan Fitzgerald
Tuesday 1 November 2022
SFRA Skew has been pummeled over the past month...
0
Comments (0)
Darren Krett
Monday 20 February 2023
Share on:
Post views: 10700
Categories
Uncategorized
[video width="1920" height="938" mp4="https://leviathanwebstorage.blob.core.windows.net/wpstorage/2023/02/skew-help.mp4"][/video]
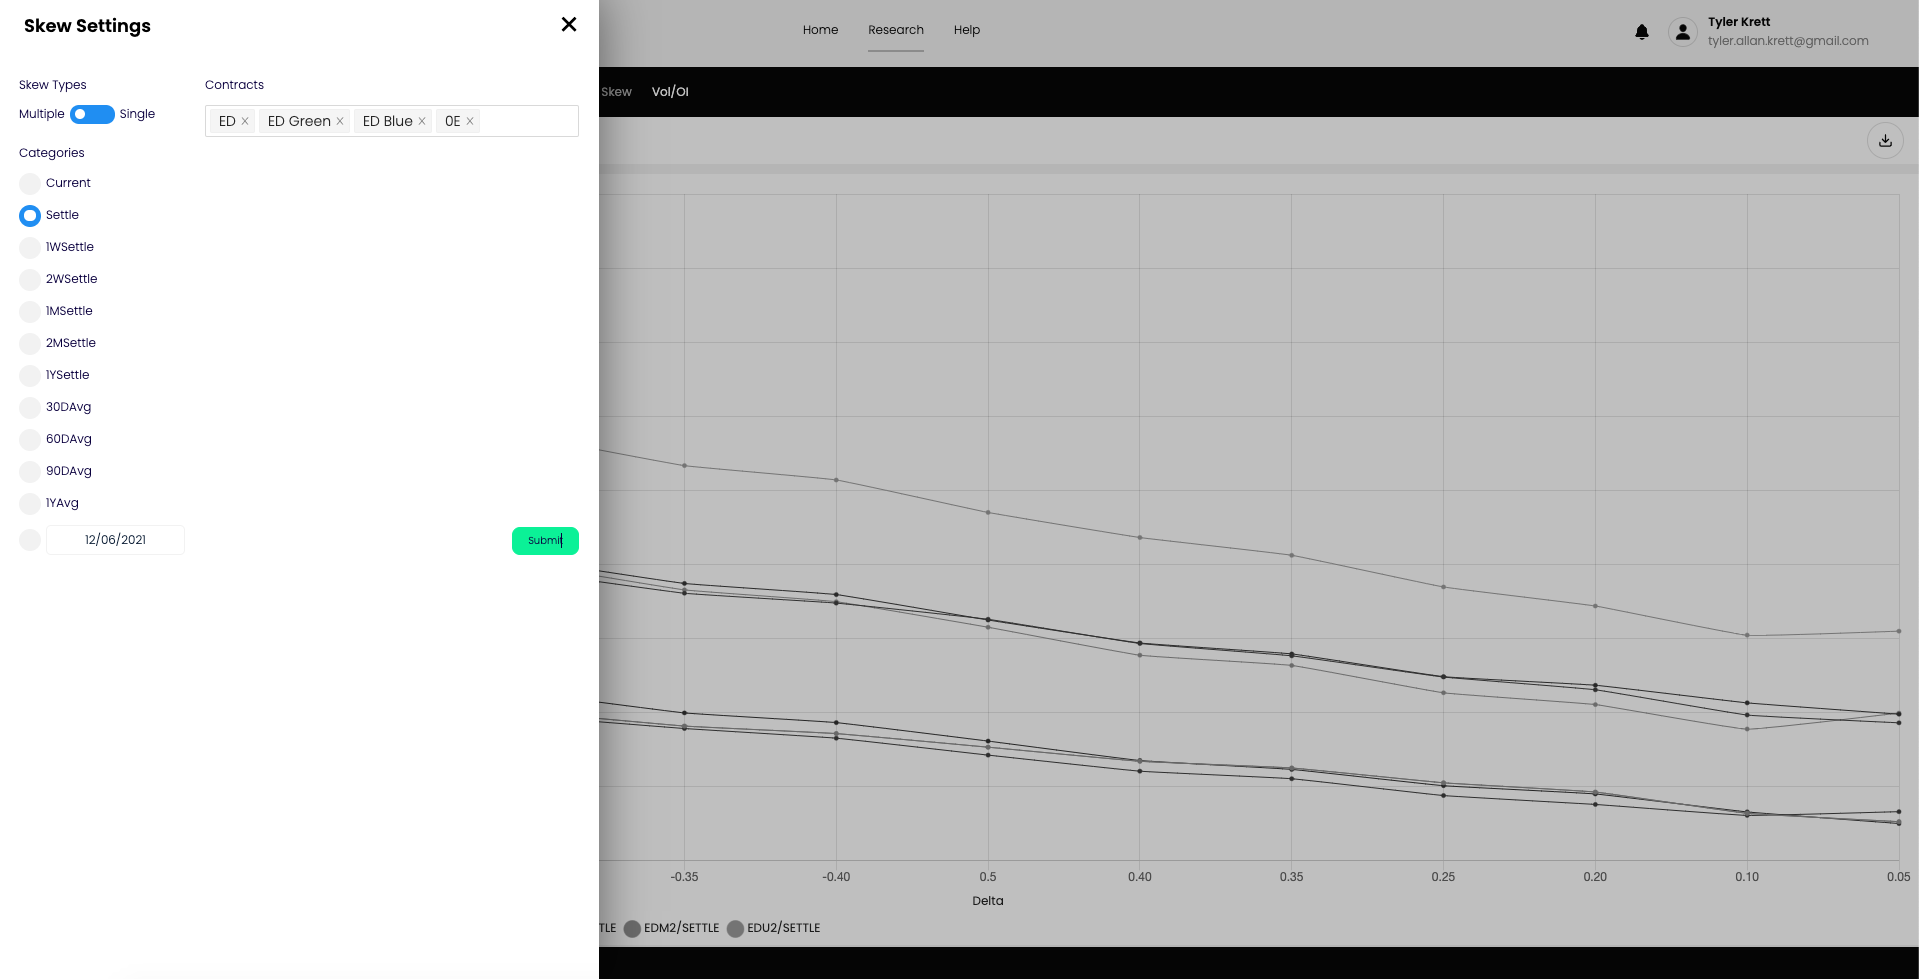
The Skew Page can be described as looking at many option expiries skews one way or looking at one option expiry skew many ways.

The page defaults to comparing the skews of many expiries and defaults to the previous day’s settlements. The Y axis is the annualized volatility and the X axis is the delta. The page can easily be edited by selecting or de-selecting the expiries to be compared. I changed the inputs to all June expires in the next example. The color key is below the charting area.

To look at a single expiry many ways simply click the green Single button. This will default to only one expiry which can easily be changed via the dropdowns. More importantly, a green Add Curve button will appear in the far left input box. These will provide a number of different ways to compare the same expiry. Below are the inputs and the output to see the EDM0 expiry comparing last night's settlement price, the settle 1 week ago, 1 month ago, and the 30 day average.


Bryan Fitzgerald
Tuesday 1 November 2022
0
Comments (0)