Darren Krett
Monday 20 February 2023
Technical Analysis
0
Comments (0)
Darren Krett
Monday 20 February 2023
Share on:
Post views: 18642
Categories
Help
Heat Map is a forward looking tool to show how a structure performs with respect to time elapsing and future movement. Some structures monetize quickly with respect to futures movement and some don’t monetize much at all until very near expiration. It is important to know the intricacies of the path rather than just knowing what the structure looks like on expiration as most structures will not be held to expiration. To look at a structure's Heat Map, simply hit the Heat Mapbutton in the upper left position of the Structure Tablepage.

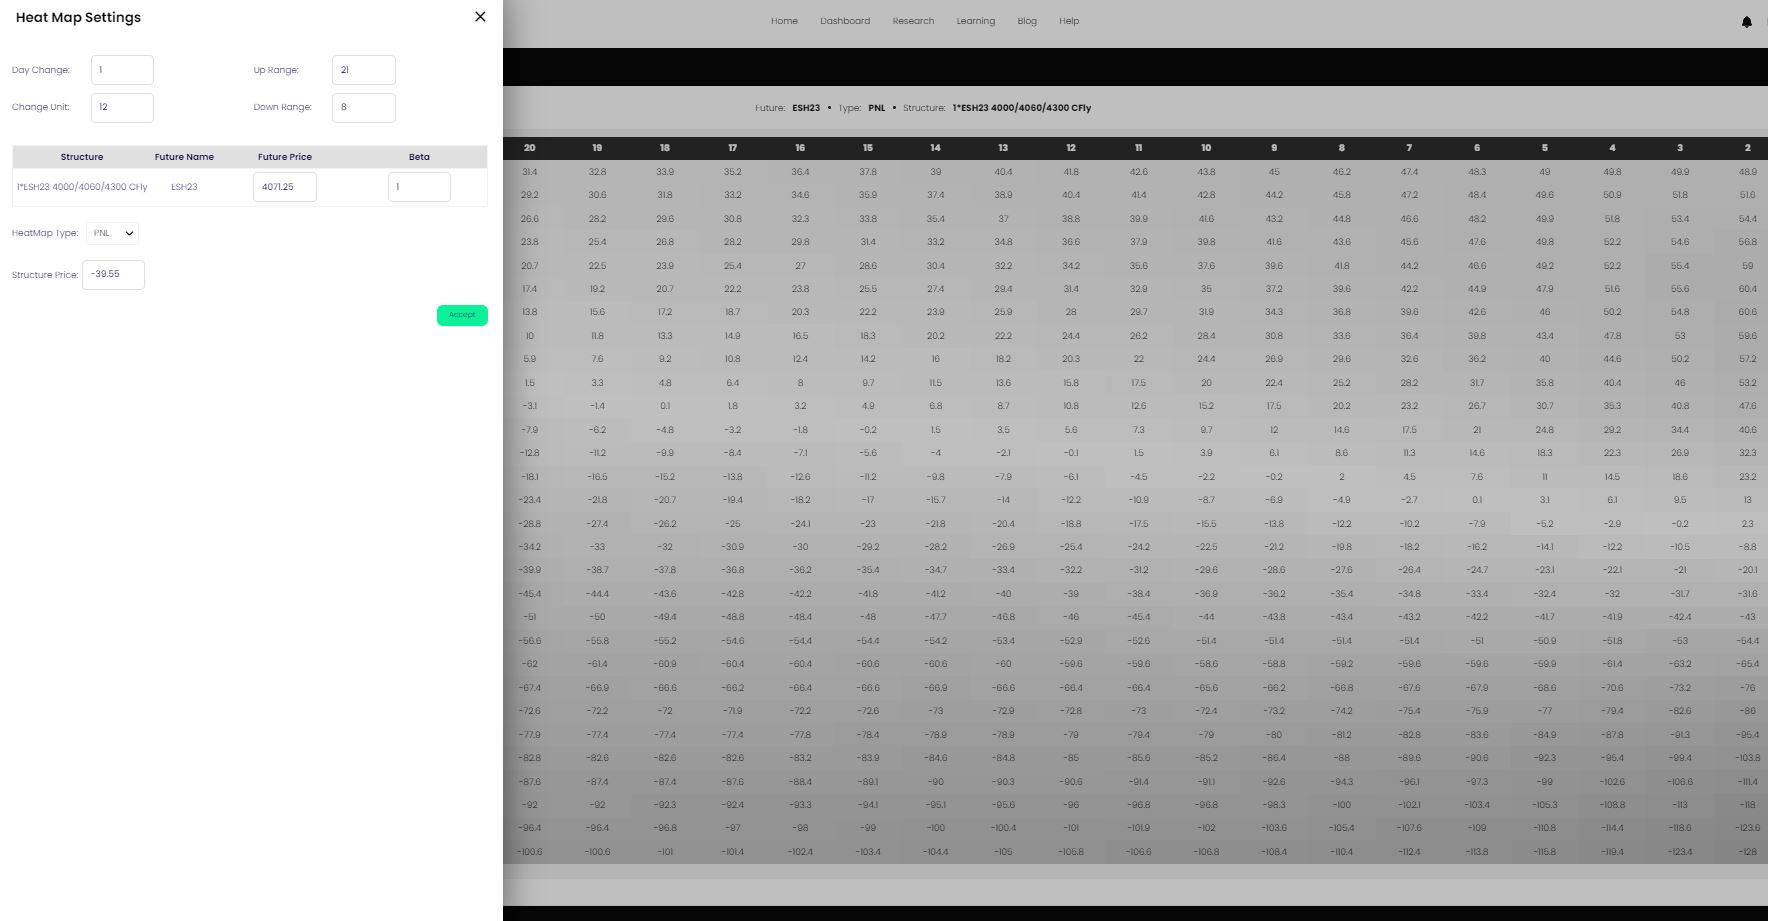
The following are editable Fields in your heat map settings:
 Day Change =
DTE (Days To Expiration)
Change Unit = The futures price increment used in the Y axis
Up Range and Down Range = The number of futures “units” you want to see on the upside and downside. For example, if the Unit is set to 5 and the Up Range is set to 10 and the Down Range is set to 5, then the grid will show futures +50 to -25.
Future Price = The futures price can be adjusted for a clearer table. This defaults to current underlying.
Beta = This is used in calendar spreads. Not all futures move at the same speed, especially in Eurodollars. The Beta we use is the 60 day average to take out the noise. For example, the EDH1/EDH2 Beta is currently 1.2. This means that for every 1 basis point move in EDH1, we expect 1.2 basis points of movement in EDH2 as it has averaged over the past 60 trading days.
Heat Map Type = We can look at the path of PnL, Delta, or Vega with respect to time and futures movement. Although P&L is king, it is important to see how the positions greeks will look as time goes on and futures move.
Structure Price = This defaults to the Theoretical Price on the Structure Table page. However, that price is not always a tradeable price and it makes sense to put in the actual tradeable price.
By changing the Up Range to 25, the Down Range to 0, the Unit to 2.5, the Future price to 9937.5, and the Structure price to the offer price of 3.25, we get a much cleaner Heat Map.

Darren Krett
Monday 20 February 2023
0
Comments (0)

Darren Krett
Tuesday 31 January 2023
0
Comments (0)