Darren Krett
Thursday 9 February 2023
Share on:
Post views: 3074
Big Boy (BB1)
Categories
Help
BIG BOY SCENARIO ANALYZER
 You start off by selecting one of the green buttons (“build” will appear if you have none created)
In this example we are using Apple and this is the first window that will pop up
 In the panel all the available expirations will appear
 , so this would represent the options that are expiring 2/17/23
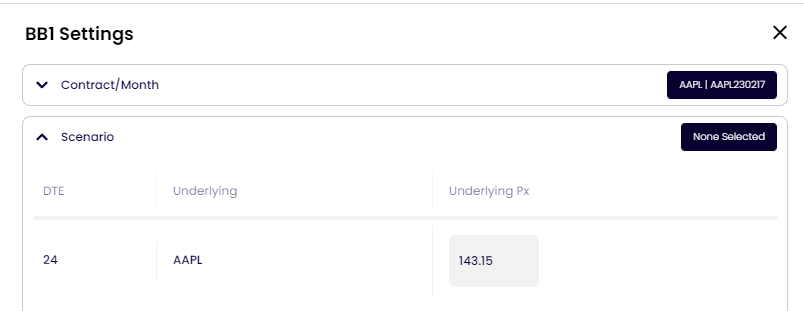
Once you have selected the expiration, this window will appear

There are just 3 parameters you need to look at.
In the top part of the panel you will see the month you selected.
The DTE (Days To Expiration) and where the underlying is currently trading
Next you need to have an idea of direction or “target” price.
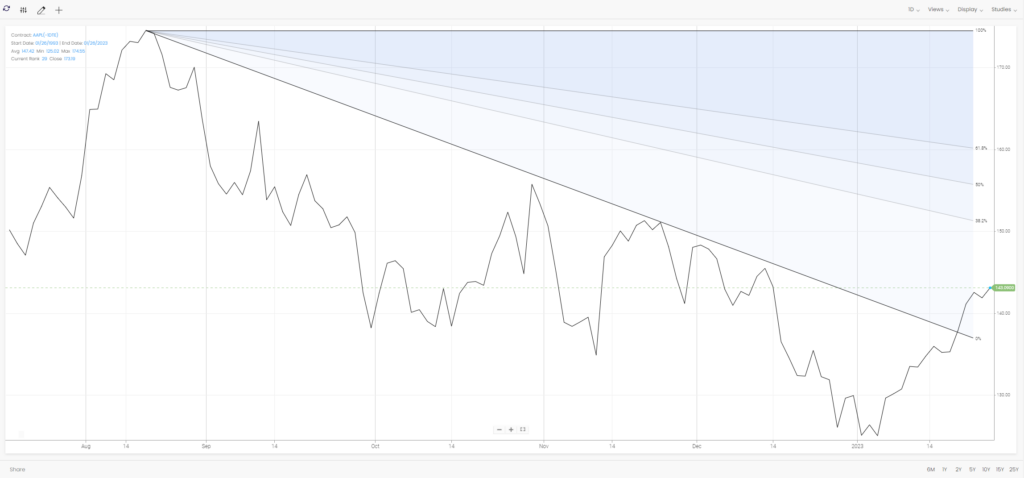
In this example, I have ascertained that it could retrace the recent decline, back up to the $174 area, having broken out of its downtrend….so I chose 174.93 as my target;
Now, with any scenario, it is unlikely that you will be 100% right and BB1 can take that into account….
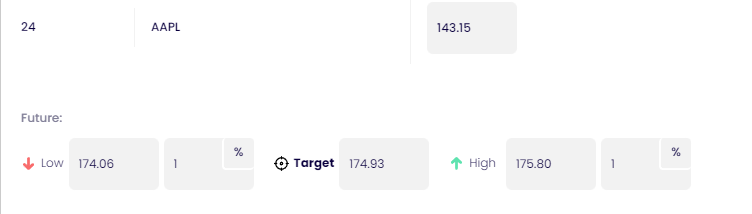 In the above example, although my target is set to 174.93 I want to say that , although my target is that , it could also be within 1% of that, so I want to make money between 174.06 and 175.80. This can be widened to as much as you like and BB1 will skew its calculations accordingly.
Next up is the timeframe….when do you expect it to hit your target…
In the above example, although my target is set to 174.93 I want to say that , although my target is that , it could also be within 1% of that, so I want to make money between 174.06 and 175.80. This can be widened to as much as you like and BB1 will skew its calculations accordingly.
Next up is the timeframe….when do you expect it to hit your target…
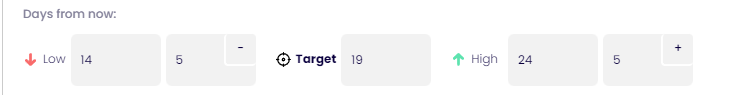 In this example, it defaults to 5 days prior to the expirationdate + or – 5 days. This can be changed to whatever you want and as wider timeframe (+/- 2 weeks if you like), only limited to the expiration date of the month you selected.
The final panel you can decide to imply moves in volatility too…inm most cases you will leave this alone, but once used to it and you gain more confidence in options themselves, you may wish to build a what if scenario where there is a large move in the implied volatility, along with a move in the underlying…
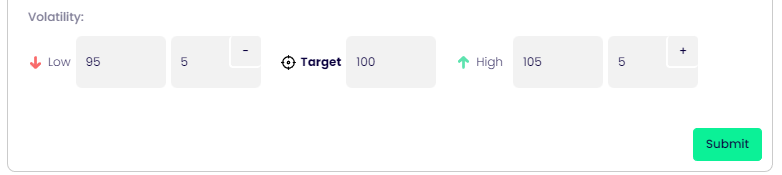 The target volatility is showing 100% of the current implied, which is saying that there is no move and that implied volatility is the same as it has been. If you selected 75% that would imply a drop of 25% of the underlying implied volatility.
In this example APPL implied volatility is , so a 25%
The target volatility is showing 100% of the current implied, which is saying that there is no move and that implied volatility is the same as it has been. If you selected 75% that would imply a drop of 25% of the underlying implied volatility.
In this example APPL implied volatility is , so a 25%
Once you are happy with your selections you hit “submit” and you will see a card appear like this
 The hourglass is showing you that the system is going through its process
Once completed it will look like this;
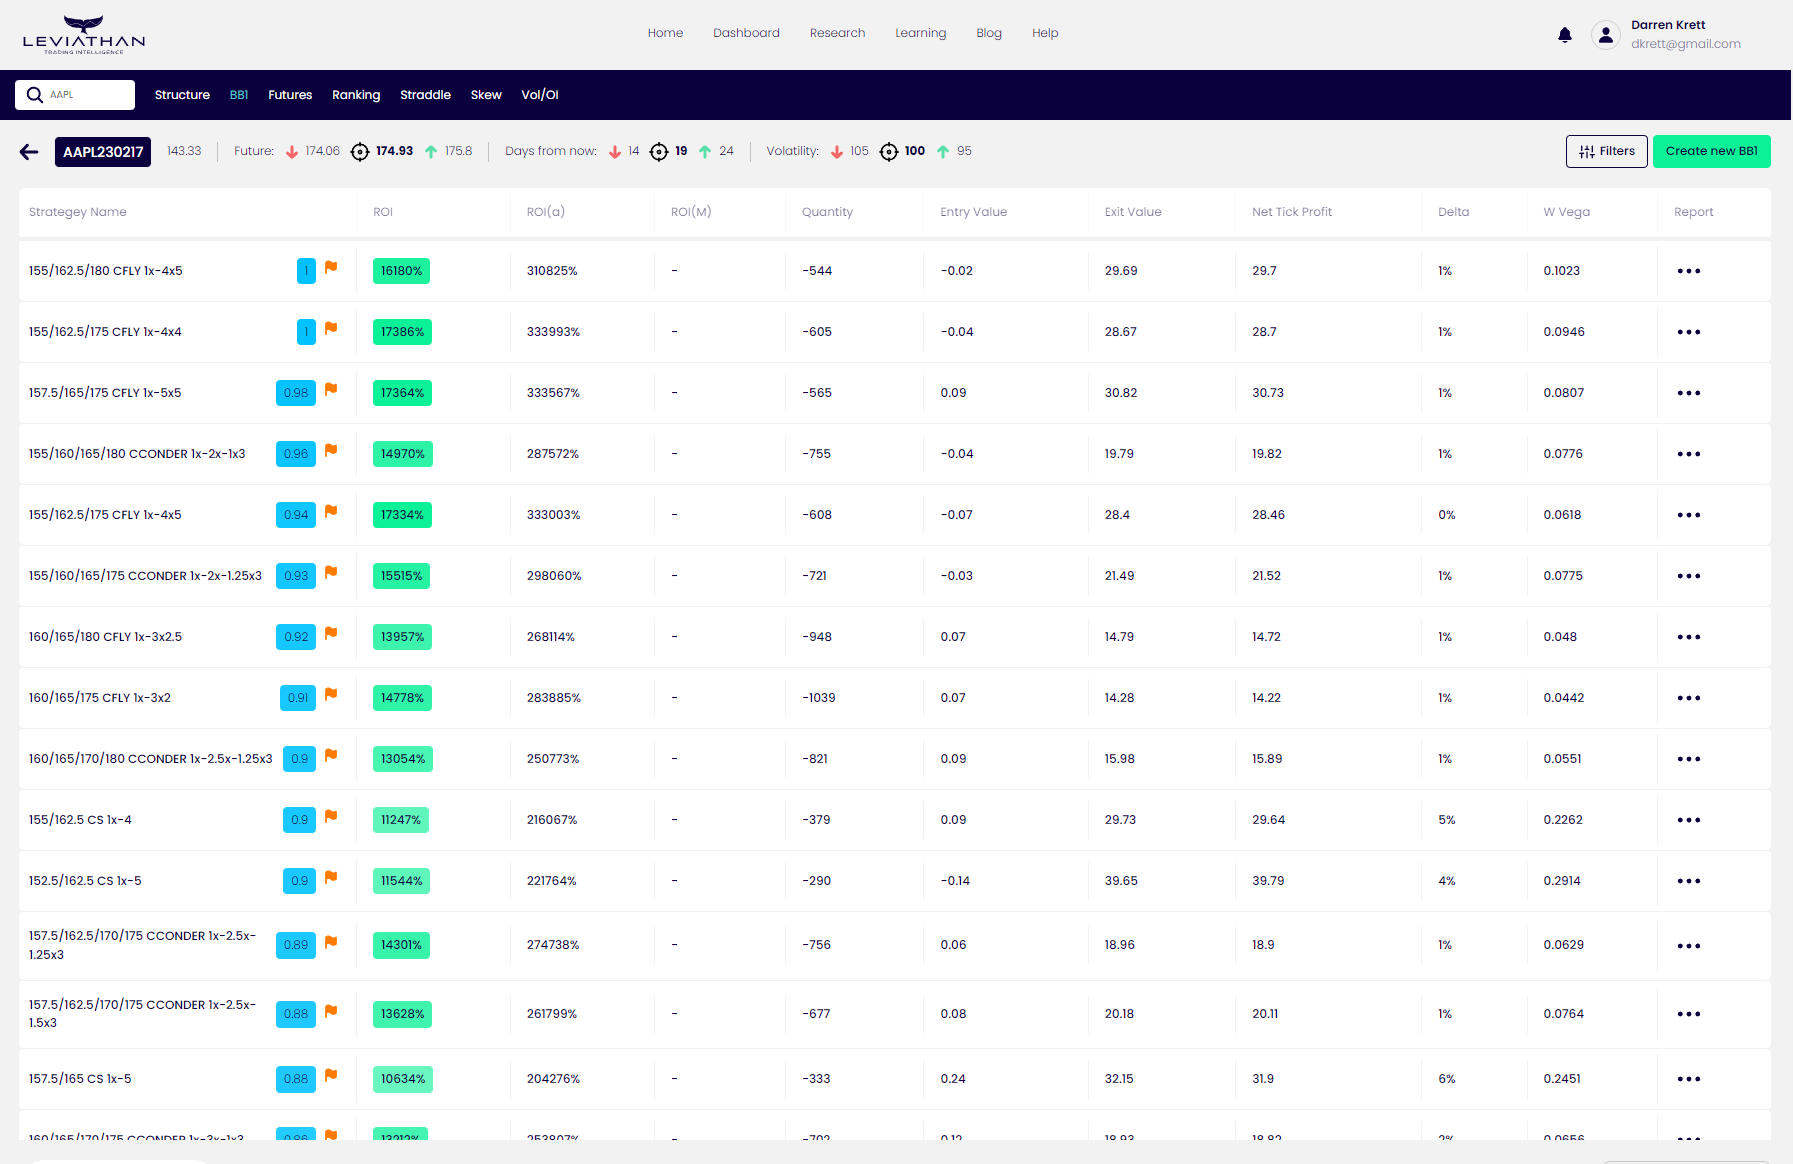
 you can click on your new "card" and a table will appear with each line showing you a trades based on the targets you selected
If you trade options, you will know that whoever you use will charge you for the risk of the trade, you can filter BB1 depending on your risk tolerances, but we will come to that later…
BB1 calculates its percentage returns based per $100k of premium/margin used and what the return on that would be….
 Firstly, lets go through what each column represents
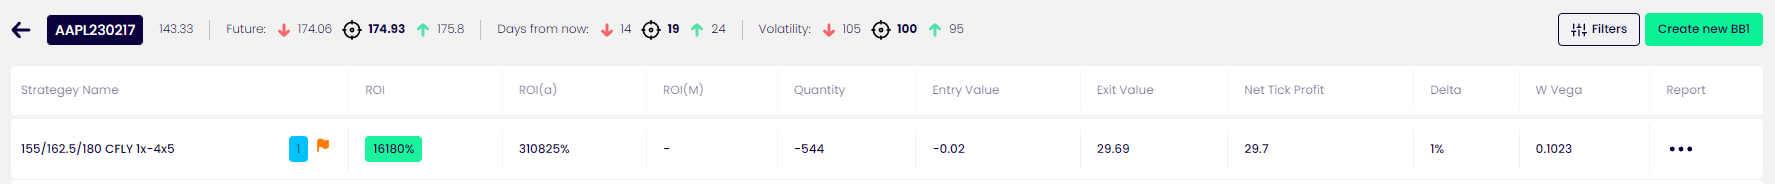
The ROI column
This is a percentage return based on your parameters, in this example the 155/162.5/180 call fly , ratioed 1 x 4 x 5 is a rather tasty 16000% return if you are right!
The ROI (a) column
This is just an annualized equivalent of your returns on that chosen strategy. (so if your timeframe is 3 months that return is extrapolated over an entire year)
The ROI column
The quantity that you can buy using a notional $100k of margin
ENTRY VALUE
This is your expected entry trade price. Sometimes you may have to opportunity to enter it cheaper but sometimes the market wont sell it to you, but if you can, all your return calculations will be based on this entry price.
EXIT VALUE
Tis is the expected price you should exit at given the timeframe you selected. We look at the THEORETICAL price at the point of time in the future and
NET TICK PROFIT
This is the expected pri
DELTA
This is the DELTA of the trade at point of entry (where it currently is)
W VEGA (weighted Vega)
Firstly, lets go through what each column represents
The ROI column
This is a percentage return based on your parameters, in this example the 155/162.5/180 call fly , ratioed 1 x 4 x 5 is a rather tasty 16000% return if you are right!
The ROI (a) column
This is just an annualized equivalent of your returns on that chosen strategy. (so if your timeframe is 3 months that return is extrapolated over an entire year)
The ROI column
The quantity that you can buy using a notional $100k of margin
ENTRY VALUE
This is your expected entry trade price. Sometimes you may have to opportunity to enter it cheaper but sometimes the market wont sell it to you, but if you can, all your return calculations will be based on this entry price.
EXIT VALUE
Tis is the expected price you should exit at given the timeframe you selected. We look at the THEORETICAL price at the point of time in the future and
NET TICK PROFIT
This is the expected pri
DELTA
This is the DELTA of the trade at point of entry (where it currently is)
W VEGA (weighted Vega)
REPORT
This is an important component when evaluating the trade that you have selected to look at;
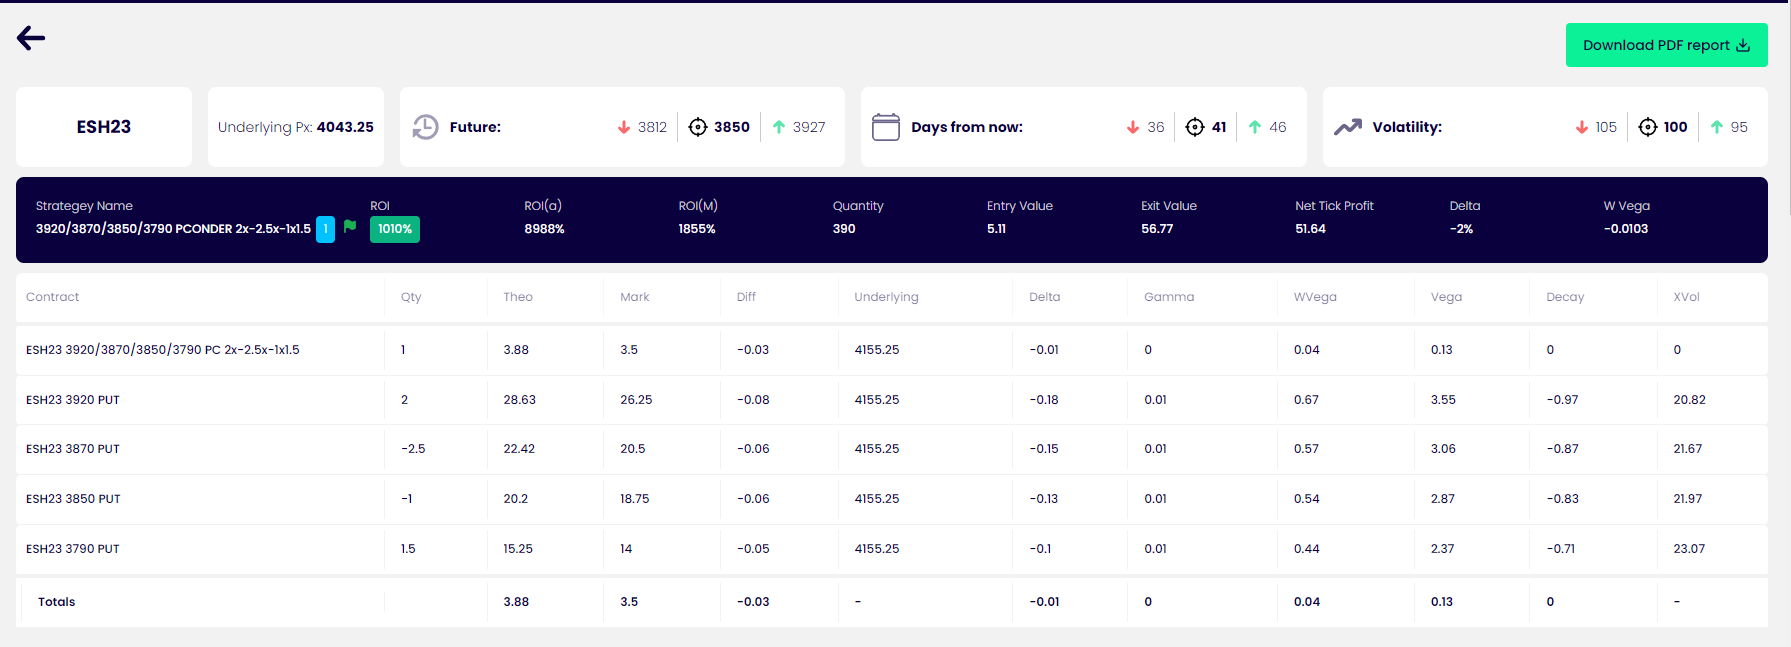 The top of the report highlights the details and breakdown of trade you have decided to look at with the individual greeks of each leg of the trade. You can also download the report into a PDF format.
You also have 3 HEAT MAPS (see HEAT MAP description for details)
The top of the report highlights the details and breakdown of trade you have decided to look at with the individual greeks of each leg of the trade. You can also download the report into a PDF format.
You also have 3 HEAT MAPS (see HEAT MAP description for details)
 Given that volatility is a major component of your strategy’s price over time, we run 3 heat maps for where volatility is currently and where the P&L (profit and loss) would be in a low volatility environment and a high volatility environment.
THE FILTERS
 As the system analyses every type of trade to give you the best returns (over 60 million calculations) there are many different types of trade, some of which may not be to everyone’s taste.
To simplify this process you can select either “all” which includes every type of trade OR “vanilla” that will just include basic strategies
As the system analyses every type of trade to give you the best returns (over 60 million calculations) there are many different types of trade, some of which may not be to everyone’s taste.
To simplify this process you can select either “all” which includes every type of trade OR “vanilla” that will just include basic strategies
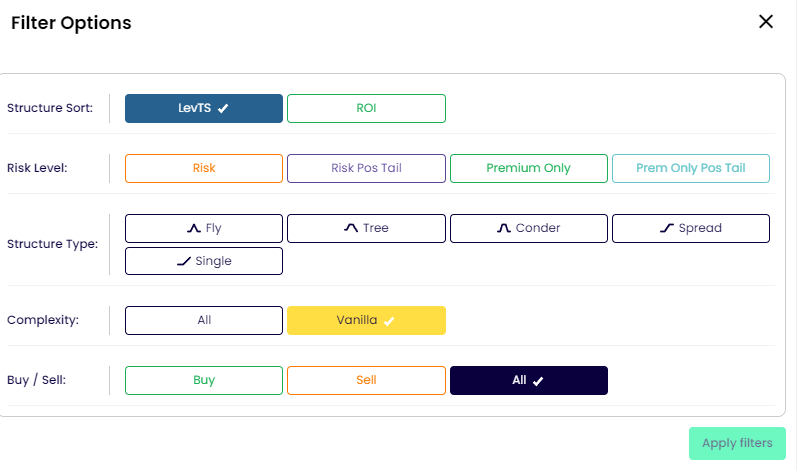 You can filter the results even further to just have certain types of strategies.
The SORTING is also an important component to know. STRUCTURE SORT Initially we rank the trades via our proprietary system that assesses the risk/reward of each individual trade and ranks it accordingly. You have the option here to use our ranking or just rank them in order of the ROI (Return On Investment) RISK LEVEL “RISK “ will include trades that have a potential downside, so if youre right you will do very well , but if you are wrong, you will need to see the HEAT MAP to see how much it could cost you. “RISK POS TAIL” means there is risk top this trade, but if you are hopelessly wrong the structure will actually make you money “PREMIUM ONLY” means that the risk to your trade is ONLY the premium outlay for the structure, nothing more. “PREMIUM ONLY POSITIVE TAIL” also means that the risk to your trade is ONLY the premium outlay BUT if you are wrong in your prediction the structure may ALSO make money
BUT WHAT IF I WANT TO CHART THE STRUCTURE AND SAVE IT? Just click on the row then it will automatically generate it in the structure panel where you can choose to save that trade to the WATCHLIST or chart it via the LINE CHART