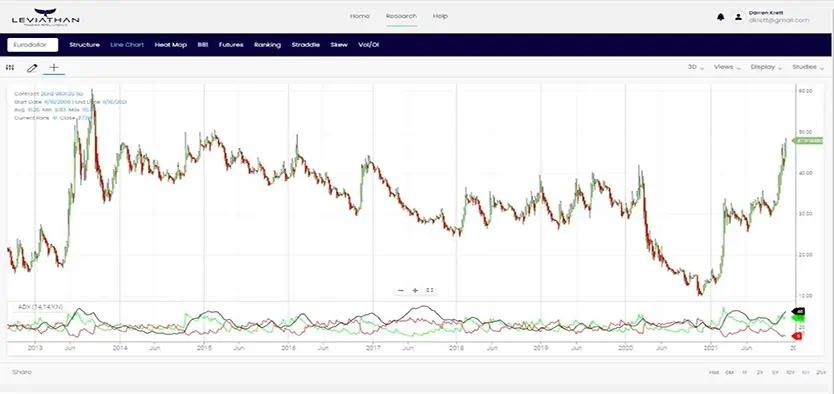
Line Chart
No other line chart can compare

What is line chart?
Leviathan Line Chart – The World’s Most Powerful Financial Analysis Chart system with 100’s of available studies Mobile responsive. Stay ahead with Leviathan, leave it to us we do all the leg work
Why is technical analysis so important?
Technical analysis focuses on examining and anticipating price movements in financial markets. Technical analysts learn to identify historical market patterns so they can predict forthcoming market trends and make smart trending decisions based on those predictions. Not surprisingly, an enterprise technical analysis solution helps visualize movements and patterns in a meaningful way.
How can Leviathan help with line chart?
When you have an option strategy, future, or equity in mind it is as easy as 1,2,3 with LeviathanFM. We are the only service that can easily provide historical charting on complex options strategies with a click of a button. With 100’s of different studies, you can visualize options historically or within a specific time span and view events that occur within it as it relates to the market and analysis all the relevant data points allowing you to comprehend the interrelationship between options and complex events.