Heat Map
A fundamental risk management tool

What is heat map?
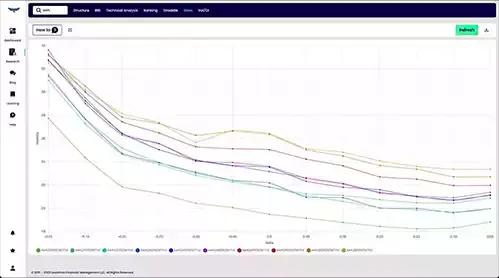
Skew is the graphical image of Implied Volatilities of a particular Stock/Future expiry displayed in strike or Delta space. Skew is simply drawing a line to connect these various points. The Skew graph can take on three different characteristics. The Security can have a Normal Skew, Positive Skew, or Negative Skew. Normal Skew is actually quite rare as it is a skew curve that looks like a “U”. The current price (At the money) implied volatility is the cheapest along the curve with equal weighted risks to both the call and put side. A positive Skew is when the Call side implied volatility is much more expensive than the Put side. A Negative Skew is the opposite as the Put side is more expensive than the Calls. There are various drivers of Skew, but the easiest to explain and understand is in an equity index. The negative skew is extremely obvious in the Indices as Put options are a natural hedge for asset managers, hedge funds, pension funds, and others who are all invested on the long side of the market.
How do heat maps help a trader?
Option traders need to know about Skew for three main reasons. First, it is incredibly important to know if an option is rich or cheap compared to other delta options. Second, it is equally as important to know whether a particular option is historically rich or cheap compared to itself. Mean reversion is a sound trading strategy because historically rich or cheap options do tend to revert back to normal levels. Third, the shape of a particular Skew will help the trader with strike selection in a structure. For example, if I as a trader am bullish Tesla stock and want to express my view using options. There are numerous structures that I can choose from, but which one? If the 30 Delta call is the low point on the skew curve and call skew goes aggressively higher, it may be a smart play to take advantage of that steep skew and buy the 30 delta Call as part of a vertical Call spread.
How can Leviathan heat maps help you trade?
Leviathan has Skew analysis that is second two none. Leviathan Skew allows its members to analyze Skew in to very distinct ways. First, the trader can look at one single expiry over many historical time frames. Second, the trader has the ability to look at all of the expiries of a particular stock/future and compare those with each other. This knowledge now allows the trader to make an informed decision as to whether the skew was historically rich/cheap, and if so, which expiry is the richest/cheapest. With this knowledge now in hand, the trader can intelligently implement their strategy with confidence.